North Carolina NICS Checks vs. Income, Employment, and Outdoor Participation (5-Year Correlation Snapshot)
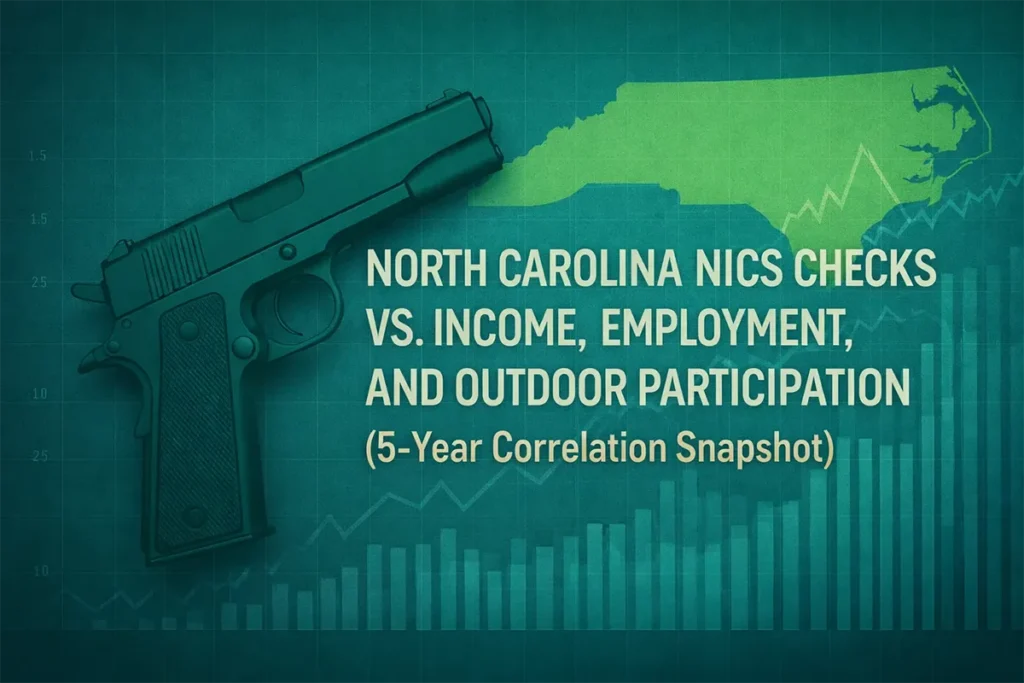
North Carolina NICS Checks vs. Income, Employment, and Outdoor Participation (5-Year Correlation Snapshot) If you’ve ever wondered what really moves North Carolina NICS checks—paychecks, jobs, or outdoor participation—this chart gives a clean, data-first clue. It compares North Carolina background-check activity against several economic and recreational indicators over a 5-year window, showing which relationships look meaningful […]
Montana NICS Checks Correlation: What 5 Years of Economic and Recreation Signals Suggest
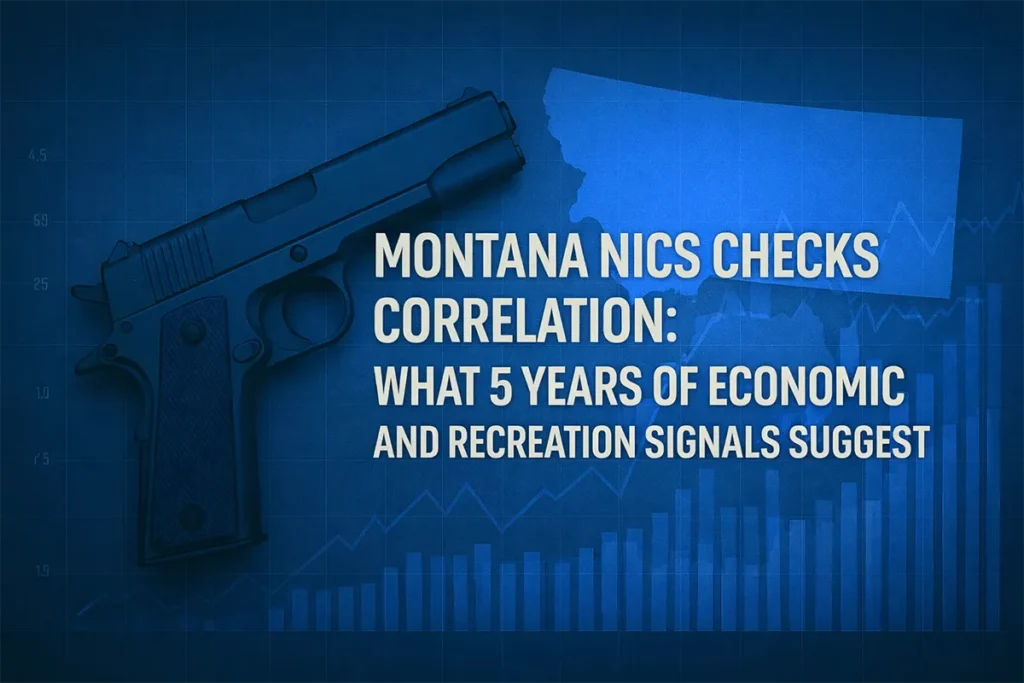
Montana NICS Checks Correlation: What 5 Years of Economic and Recreation Signals Suggest If you’ve ever wondered what tends to move alongside NICS checks in Montana—income, spending, employment, hunting activity, or time spent shooting—this 5-year correlation view gives a practical starting point. It doesn’t prove cause and effect, but it does show which lines usually […]
Colorado NICS Checks vs Economic and Recreation Indicators: What the 5-Year Correlations Suggest
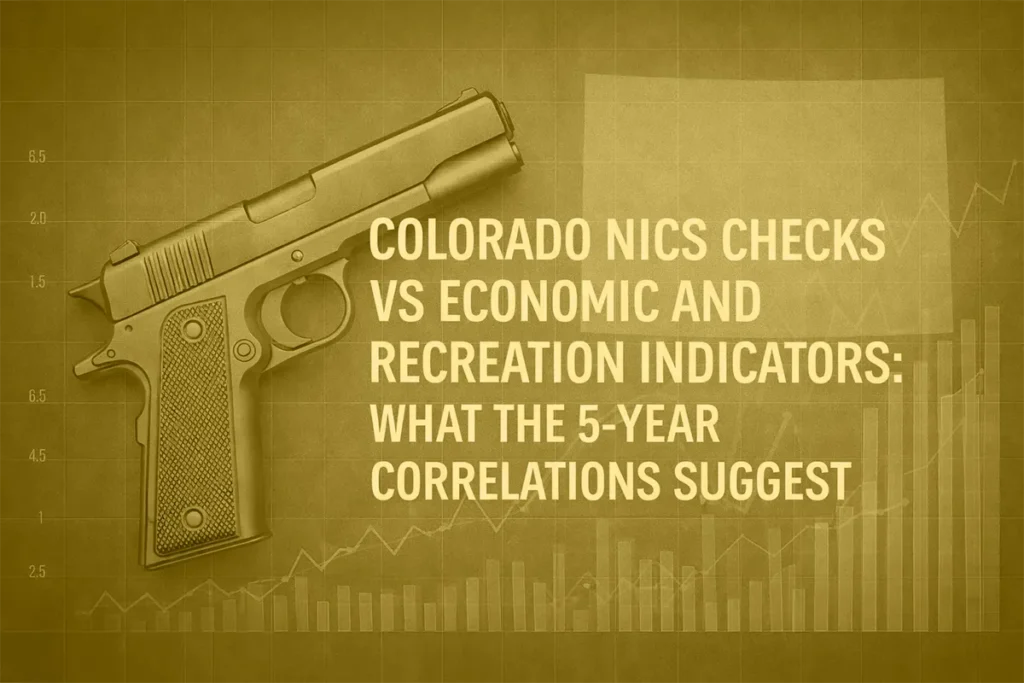
Colorado NICS Checks vs Economic and Recreation Indicators: What the 5-Year Correlations Suggest If you’ve ever wondered what’s “moving with” Colorado NICS checks—jobs, spending, hunting participation, or broader shooting activity—this correlation view is a fast way to spot relationships worth paying attention to. In this post, we’ll walk through what the chart shows, which pairings […]
Arkansas NICS Checks Correlations (5-Year View): What the Data Suggests About Jobs, Income, and Outdoor Activity

Arkansas NICS Checks Correlations (5-Year View): What the Data Suggests About Jobs, Income, and Outdoor Activity If you’ve ever wondered whether Arkansas NICS checks move with the broader economy—or with outdoor recreation like hunting and shooting sports—this visual is a quick reality check. The dashboard below summarizes a 5-year correlation view for Arkansas, comparing several […]
Indiana NICS Checks: What 5 Years of Data Say About Employment, Spending, and Shooting Activity

Indiana NICS Checks: What 5 Years of Data Say About Employment, Spending, and Shooting Activity Wondering what’s really driving Indiana NICS checks? We analyzed a 5-year correlation matrix for Indiana and translated the chart into plain-English insights you can use. Below you’ll learn what the image shows, why employment stands out, how consumer spending fits […]
Oregon NICS Checks vs Economic and Recreation Indicators (5-Year Correlation Snapshot)
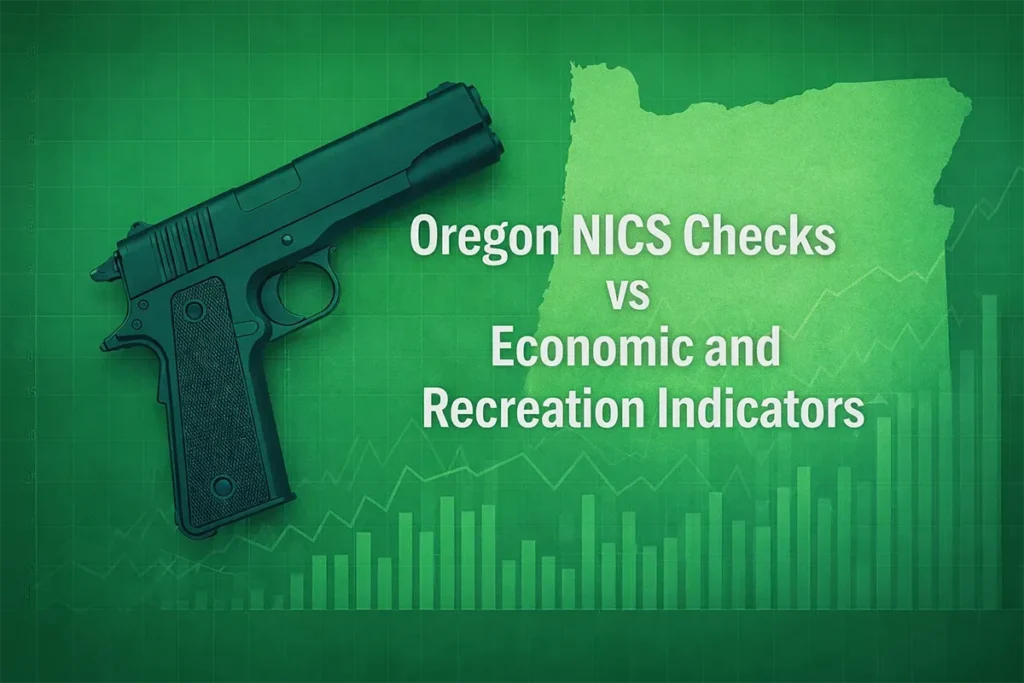
Oregon NICS Checks vs Economic and Recreation Indicators (5-Year Correlation Snapshot) If you’ve ever wondered what’s “driving” Oregon NICS checks—income, jobs, hunting activity, or something else—this 5-year snapshot helps you separate signal from noise. Using a correlation grid, the image compares several economic and recreational indicators against four NICS check measures to show which relationships […]
Maine NICS Checks: When Hunting Activity Drives Demand
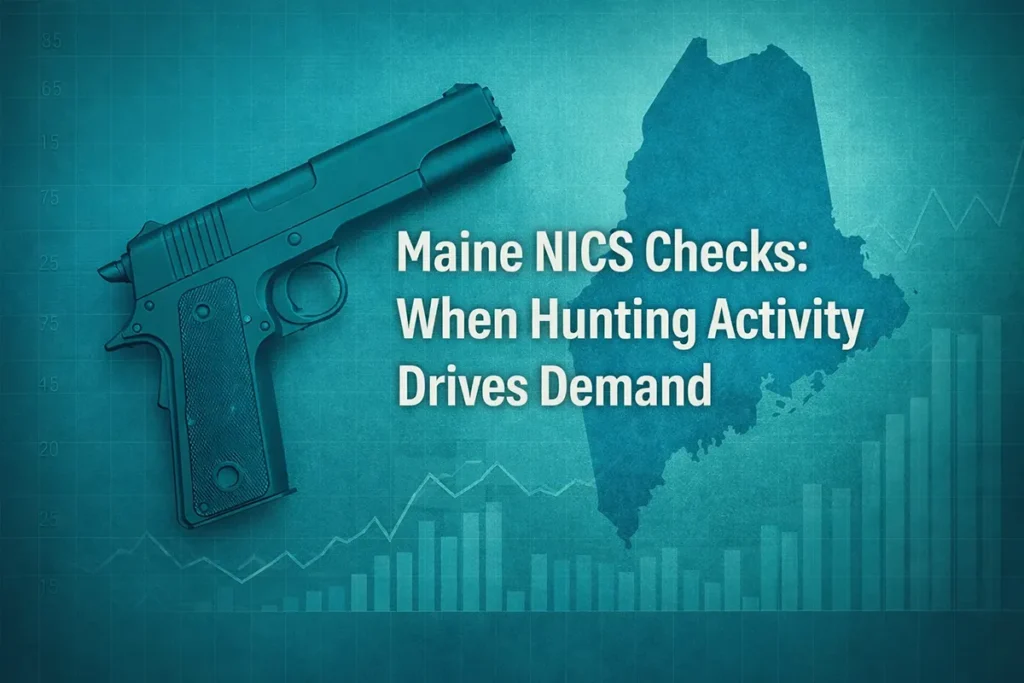
Maine NICS Checks: When Hunting Activity Drives Demand If you’ve ever tried to guess when firearm demand is about to heat up in Maine, you’ve probably heard a dozen theories: “It’s the economy,” “It’s the election cycle,” “It’s ammo prices,” and so on. This Outdoor Analytics view takes a simpler angle—looking at how Maine’s background […]
Missouri NICS Checks vs. Jobs, Income, and the Outdoors: What the Last 5 Years Suggest
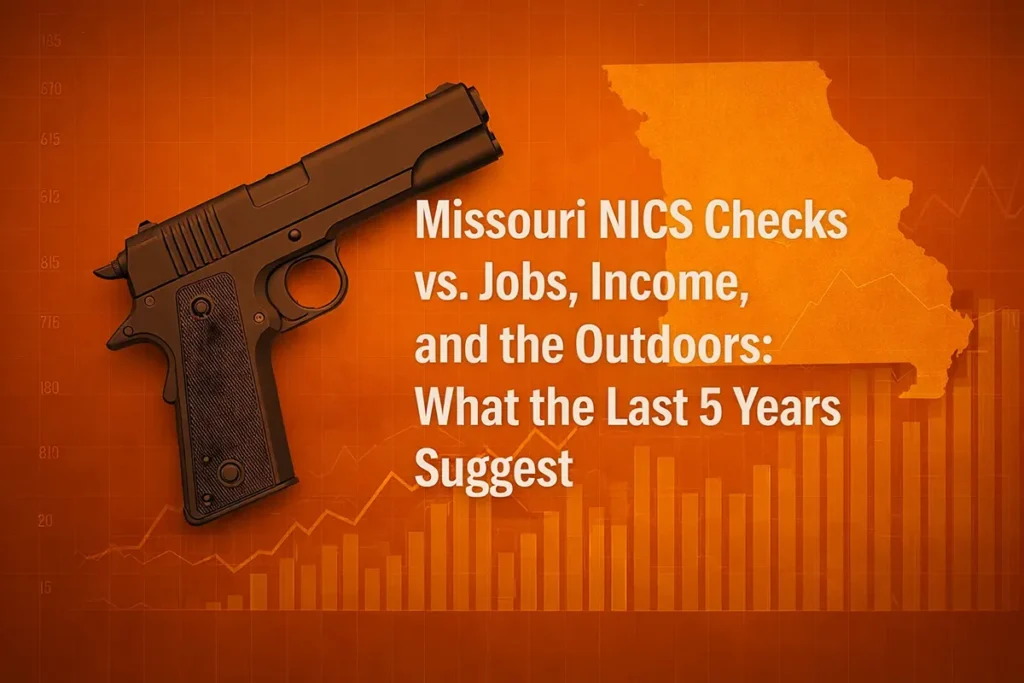
Missouri NICS Checks vs. Jobs, Income, and the Outdoors: What the Last 5 Years Suggest If you’ve ever wondered what really nudges Missouri NICS checks up or down, this Outdoor Analytics view gives us a solid clue: it’s not income, it’s not spending, and it’s not even hunting participation by itself. Over the last five […]
NICS Checks vs. New Jersey’s Economy: What 5 Years of Data Says
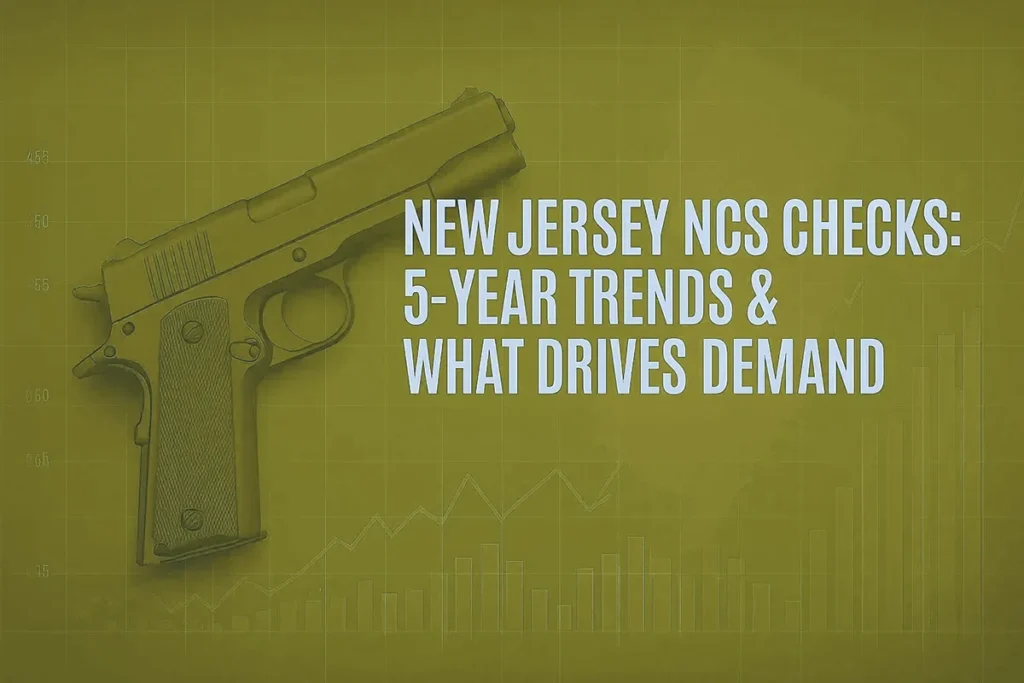
NICS Checks vs. New Jersey’s Economy: What 5 Years of Data Says If you’ve ever wondered how background checks for gun purchases move with the Garden State’s economy, this quick read is for you. We pulled insights from a five-year Outdoor Analytics correlation dashboard for New Jersey to see how things like personal income, consumer […]
Michigan NICS Checks: What’s Really Driving the Numbers?

Michigan NICS Checks: What’s Really Driving the Numbers? Ever wonder what nudges firearm background checks up or down in Michigan? We put five years of data under the microscope to see how NICS checks line up with everyday forces like income, employment, and time spent outdoors. The short version: Michigan NICS checks rise with personal […]