Montana NICS Checks Correlation: What 5 Years of Economic and Recreation Signals Suggest
If you’ve ever wondered what tends to move alongside NICS checks in Montana—income, spending, employment, hunting activity, or time spent shooting—this 5-year correlation view gives a practical starting point. It doesn’t prove cause and effect, but it does show which lines usually rise and fall together over time.
In this post, you’ll get a plain-English walkthrough of what the chart shows, a complete data table pulled directly from the image (no guessing), and safe, realistic next steps for shooters, hunters, retailers, and industry teams.
Quick Take
- Handgun checks track the most indicators in this 5-year Montana view (income and recreation measures show the clearest alignment).
- Adjusted checks also line up with recreation signals (hunting/trapping and shooting including archery both move in the same direction more often than not).
- Long gun checks look less connected to these specific indicators here (lower r values and higher p values across all shown rows).
- Use this as a planning signal, not a “why” answer: correlation shows what moved together, not what caused changes.
- If you’re buying gear: when participation is rising (more events, more classes), popular items and services can get more competitive—shopping earlier can reduce stress.
What the image shows
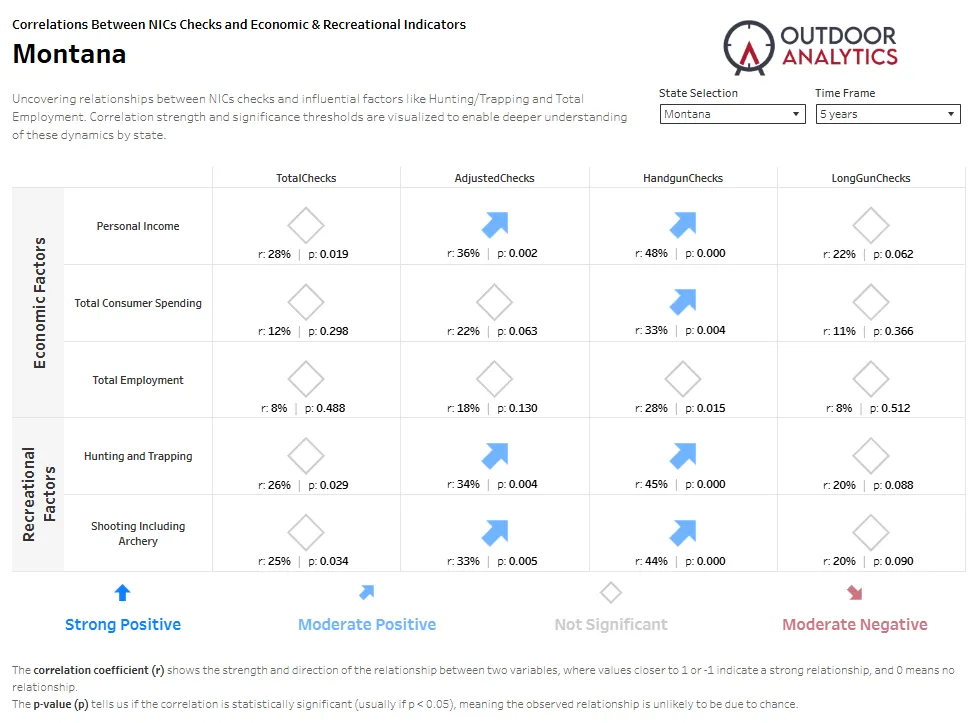
The dashboard is titled “Correlations Between NICS Checks and Economic & Recreational Indicators.” It is filtered to Montana with a 5 years time frame.
Across the top are four NICS check categories:
- TotalChecks
- AdjustedChecks
- HandgunChecks
- LongGunChecks
Down the left are the indicators being compared (grouped as Economic Factors and Recreational Factors):
- Personal Income
- Total Consumer Spending
- Total Employment
- Hunting and Trapping
- Shooting Including Archery
Each cell shows an r value (how strongly the two trends tend to move together) and a p value (a significance check). The note on the image says significance is “usually” when p < 0.05.
The biggest takeaways
- Handgun checks show the strongest “moves together” pattern across the indicators shown, including personal income (r: 48%, p: 0.000) and both recreation indicators (r: 45% and 44%, p: 0.000).
- Adjusted checks are consistently moderate-positive with personal income (r: 36%, p: 0.002) and recreation signals (r: 34%, p: 0.004; r: 33%, p: 0.005).
- Total checks show smaller positive relationships versus income and participation than handgun/adjusted checks (for example, income vs total checks r: 28%, p: 0.019).
- Consumer spending stands out most for handgun checks (r: 33%, p: 0.004). Other check types look weaker or less certain in this view.
- Employment shows a meaningful relationship with handgun checks (r: 28%, p: 0.015) but looks weaker for the other check types in the image.
- Long gun checks are weakest across the board for these particular indicators in this 5-year Montana filter.
Snippet-ready definition: In this chart, r is a “moves together” score between two trends over time, and p indicates whether that relationship is likely to be meaningful rather than random noise (the dashboard notes p < 0.05 as the usual cutoff).
Data table from the image
How to read this table: Each row is an indicator (income, spending, employment, or participation). Each column is a NICS check type. Values are copied exactly as shown: r is displayed as a percent and p is shown as a decimal.
| Factor (Montana, 5 years) | TotalChecks (r, p) | AdjustedChecks (r, p) | HandgunChecks (r, p) | LongGunChecks (r, p) |
|---|---|---|---|---|
| Personal Income | r: 28% | p: 0.019 | r: 36% | p: 0.002 | r: 48% | p: 0.000 | r: 22% | p: 0.062 |
| Total Consumer Spending | r: 12% | p: 0.298 | r: 22% | p: 0.063 | r: 33% | p: 0.004 | r: 11% | p: 0.366 |
| Total Employment | r: 8% | p: 0.488 | r: 18% | p: 0.130 | r: 28% | p: 0.015 | r: 8% | p: 0.512 |
| Hunting and Trapping | r: 26% | p: 0.029 | r: 34% | p: 0.004 | r: 45% | p: 0.000 | r: 20% | p: 0.088 |
| Shooting Including Archery | r: 25% | p: 0.034 | r: 33% | p: 0.005 | r: 44% | p: 0.000 | r: 20% | p: 0.090 |
What this means for you
Beginners and everyday gun owners
In this Montana view, handgun checks are the category that most consistently moves alongside the indicators shown. If you’re trying to avoid rushed purchases, this supports a simple approach: when participation and household budgets look like they’re trending up, demand for common handgun-related items and services may move up with it.
Hunters and recreational shooters
The chart suggests the two participation indicators (hunting/trapping and shooting including archery) line up more strongly with handgun and adjusted checks than with long gun checks over this time window. If your buying decisions are seasonal, consider planning earlier when you see participation ramping up in your area.
Retailers, ranges, and trainers
If you’re staffing or ordering inventory, handgun and adjusted checks look like the more responsive “signal” categories in this image. Practical areas to monitor alongside your own internal metrics include class signups, league attendance, and range visits.
Industry analysts and brand teams
Treat these relationships as candidates to test against your own sales or lead data. In this Montana view, personal income and the participation indicators appear to align most with handgun and adjusted checks.
Concise summary paragraph: In this Montana 5-year correlation view, handgun checks show the clearest “moves together” pattern with income, consumer spending, and participation indicators, while long gun checks show weaker alignment with the same set of factors.
Smart next steps
- Use correlations for planning: they’re best for spotting patterns, not proving causes.
- Track your own leading indicators: range traffic, class signups, and event participation can help validate what you see here.
- Buy earlier during participation ramps: if classes and events are filling up, popular gear and services often get more competitive.
- Watch handgun and adjusted categories more closely if you’re using this chart as a demand signal for Montana.
- Safety reminder: follow local laws, range rules, and manufacturer guidance, and prioritize safe handling and secure storage.
Common questions
Does this prove income or participation causes NICS checks to rise
No. This is a “moves together” view over time. It can suggest useful relationships to monitor, but it does not prove what caused changes.
Which category tracks these indicators most closely in Montana
Handgun checks show the strongest and most consistent positive relationships across the indicators shown in the image.
Why do long gun checks look weaker here
In the image, long gun checks have lower r values and p values above 0.05 for every listed factor. That suggests these specific indicators do not line up as well with long gun checks over the selected time window.
What is the difference between TotalChecks and AdjustedChecks
Not shown in the image. The dashboard lists both categories but does not define how “adjusted” is calculated.
What p value threshold does this dashboard use
The note on the chart says relationships are “usually” considered significant when p is less than 0.05.
Bottom line: this Montana NICS checks correlation view suggests handgun and adjusted checks are more likely to reflect shifts in income and participation than long gun checks over the 5-year window shown. If you’re making plans—inventory, training schedules, or budget timing—start with the relationships that are clearest, and treat the rest as “needs more context.” Check out our interactive NICs Checks Dashboard page for more insights.