Oregon NICS Checks vs Economic and Recreation Indicators (5-Year Correlation Snapshot)
If you’ve ever wondered what’s “driving” Oregon NICS checks—income, jobs, hunting activity, or something else—this 5-year snapshot helps you separate signal from noise. Using a correlation grid, the image compares several economic and recreational indicators against four NICS check measures to show which relationships look meaningful and which ones don’t.
In plain terms: the chart suggests that, in Oregon over the last 5 years shown, overall NICS activity lines up most consistently with personal income and hunting and trapping, while employment, consumer spending, and several category-specific check types show weaker or “not significant” relationships in this view.
Quick Take
- What stands out: The only cells marked with positive arrows are Personal Income and Hunting and Trapping versus TotalChecks and AdjustedChecks in Oregon (5-year view).
- What’s weaker: Total Employment is essentially flat versus every NICS measure shown (tiny r values, high p-values).
- Category nuance: HandgunChecks and LongGunChecks are mostly marked “Not Significant” in this visualization, even when some p-values shown are below 0.05.
- Who this impacts: Retailers planning inventory, clubs/ranges scheduling, and competitors/hunters timing purchases and training blocks.
- What to watch next: If you’re forecasting demand, income and hunting/trapping participation may be more useful “context signals” than jobs alone—based on this one Oregon slice.
What the image shows
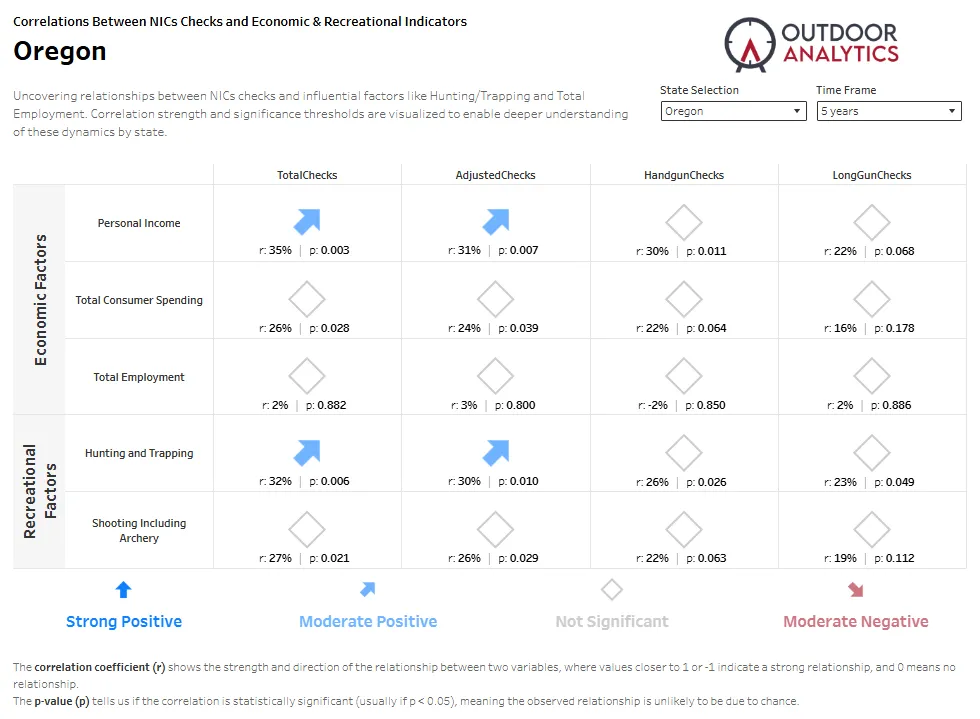
The visual is a correlation matrix titled “Correlations Between NICS Checks and Economic & Recreational Indicators” filtered to:
- State: Oregon
- Time frame: 5 years
Across the top are four NICS-related measures:
- TotalChecks
- AdjustedChecks
- HandgunChecks
- LongGunChecks
Down the left are five indicators grouped into two categories:
- Economic Factors: Personal Income, Total Consumer Spending, Total Employment
- Recreational Factors: Hunting and Trapping, Shooting Including Archery
Each cell shows:
- r (correlation coefficient) as a percent
- p (p-value) for statistical significance
- An icon legend: Strong Positive, Moderate Positive, Not Significant, Moderate Negative
Important nuance from what’s visible: many cells display “Not Significant” icons (gray diamonds) even when their p-values appear below 0.05. That strongly suggests the dashboard is applying an additional rule beyond p-value alone (for example, a minimum relationship strength threshold), but the exact threshold is not shown in the image.
The biggest takeaways
- Income shows the clearest alignment with overall checks: Personal Income is marked Moderate Positive for TotalChecks (r: 35%, p: 0.003) and AdjustedChecks (r: 31%, p: 0.007).
- Hunting and trapping aligns with overall checks too: Hunting and Trapping is also marked Moderate Positive for TotalChecks (r: 32%, p: 0.006) and AdjustedChecks (r: 30%, p: 0.010).
- Employment looks like a non-factor here: Total Employment has near-zero r values across the board (r: 2%, 3%, -2%, 2%) with very high p-values (0.800–0.886), which is consistent with “no clear relationship” in this view.
- Consumer spending trends are weak in this visualization: Total Consumer Spending shows positive r values (16%–26%) but is marked Not Significant everywhere in the grid.
- Shooting participation (including archery) is also weak here: r ranges from 19%–27%, but every cell is marked Not Significant in this Oregon view.
- Handgun and long gun category checks don’t “light up”: HandgunChecks and LongGunChecks show mostly “Not Significant” icons across all indicators.
- Practical implication: If you’re doing quick, context-based planning, the chart suggests you’ll get more mileage tracking income and hunting/trapping activity than tracking jobs alone—at least for Oregon in the 5-year window shown.
Snippet-ready definition: In this dashboard, the “correlation” value (r) describes how closely two measures move together in the same period, while the “p-value” (p) helps indicate whether that pattern is likely to be meaningful versus random noise.
Data table from the image
Below is a direct transcription of every visible r and p value in the Oregon (5-year) grid. Values are copied as shown; if something isn’t explicit in the image (like units for income/spending, or the dashboard’s exact “significance” rule), it’s listed as “Not shown.”
| Indicator (Oregon, 5 years) | TotalChecks (r) | TotalChecks (p) | AdjustedChecks (r) | AdjustedChecks (p) | HandgunChecks (r) | HandgunChecks (p) | LongGunChecks (r) | LongGunChecks (p) |
|---|---|---|---|---|---|---|---|---|
| Personal Income | 35% | 0.003 | 31% | 0.007 | 30% | 0.011 | 22% | 0.068 |
| Total Consumer Spending | 26% | 0.028 | 24% | 0.039 | 22% | 0.064 | 16% | 0.178 |
| Total Employment | 2% | 0.882 | 3% | 0.800 | -2% | 0.850 | 2% | 0.886 |
| Hunting and Trapping | 32% | 0.006 | 30% | 0.010 | 26% | 0.026 | 23% | 0.049 |
| Shooting Including Archery | 27% | 0.021 | 26% | 0.029 | 22% | 0.063 | 19% | 0.112 |
| Units, source definitions, and exact “significance” rule | Not shown | |||||||
How to read this table: Look at r first to see how closely two lines tend to move together (bigger magnitude means a tighter relationship). Then check p to see whether the pattern is likely meaningful versus random chance (the image notes p < 0.05 is “usually” considered significant). Finally, compare that to the icon in the original grid: this dashboard appears to require more than just p-value to mark a cell as “positive,” but the exact cutoff is not shown.
What this means for you
For buyers and everyday shooters
If you’re trying to time a purchase, this Oregon snapshot hints that broader “household budget health” (personal income) may track more closely with overall background-check activity than employment counts do. That doesn’t mean income causes checks—only that they tended to move together in the window shown.
Practical takeaway: when you see income trends tightening or loosening, it may be a useful context signal for how busy the market could feel (availability, wait times, and retailer promotions). Keep your expectations flexible—this is a single state and a single time window.
For hunters
The clearest recreation signal in the image is Hunting and Trapping aligning with overall checks (TotalChecks and AdjustedChecks). That suggests hunting-related participation or interest may rise and fall alongside overall check volume in Oregon during the 5-year period shown.
Practical takeaway: if you plan around hunting seasons, draw deadlines, or pre-season gear upgrades, consider monitoring participation indicators (licenses, hunter-ed course enrollment, range qualification classes—whatever you track internally) alongside your own shopping timeline.
For ranges, clubs, and instructors
“Shooting Including Archery” is positive but marked not significant everywhere in the grid. In other words, this specific visualization doesn’t show a strong, reliable tie between that participation indicator and the NICS measures displayed.
Practical takeaway: instead of assuming check volume predicts class demand, build your schedule around what you can directly observe—membership inquiries, course waitlists, league signups, and local event calendars.
For retailers and brands
If you’re using Oregon NICS checks as a planning input, the strongest “companion indicators” in this grid are Personal Income and Hunting and Trapping—but only for TotalChecks and AdjustedChecks. The category measures (HandgunChecks and LongGunChecks) don’t show clear relationships in the dashboard’s icon logic.
Practical takeaway: when forecasting, consider building two layers: (1) a top-line demand view keyed to overall check measures, and (2) a category mix view driven by your own POS history, promotions, and seasonality—because the category correlations here don’t provide strong guidance on their own.
Safety reminder: Whatever you buy or train with, follow all local laws, manufacturer guidance, and range rules—and prioritize safe storage and safe handling every time.
Smart next steps
- Pick one NICS metric to track consistently: TotalChecks or AdjustedChecks (both show the clearest “signal” in this Oregon view).
- Add two context lines to your dashboard: Personal Income and Hunting/Trapping (based on the only arrow-marked relationships shown).
- Don’t overfit to jobs numbers: Total Employment shows near-zero relationship here, so treat it as background context, not a driver.
- Validate with your own data: Compare the same 5-year period against your POS, training enrollments, lane utilization, or lead volume.
- Segment before you decide: If you care about handguns vs long guns, use your internal category sales/margin trends—this visualization doesn’t show strong category guidance for Oregon.
- Re-check on a new time window: If you can, compare 1-year vs 5-year views to see if the “income + hunting” story persists.
Concise summary paragraph: In Oregon’s 5-year correlation grid, the strongest, clearest relationships appear between overall NICS check measures (TotalChecks and AdjustedChecks) and two indicators—Personal Income and Hunting and Trapping—while employment, consumer spending, and category-specific check types show weaker or not-significant relationships in this particular dashboard view.
Common questions
Does this prove income or hunting activity causes Oregon NICS checks?
No. Correlation means two measures moved together in the period shown. It does not prove one caused the other.
Why do some cells look “not significant” even when p is below 0.05?
Based on what’s visible, the dashboard likely applies an additional rule (such as a minimum relationship strength) before it shows a “positive” arrow. The exact rule or threshold is not shown in the image.
Which indicators matter most in this Oregon 5-year view?
Personal Income and Hunting and Trapping stand out for TotalChecks and AdjustedChecks (the only arrow-marked cells in the grid).
What should retailers do with this?
Use it as a quick “context check” for top-line planning (overall checks), then rely on your own POS and seasonality for category mix decisions—because handgun/long gun correlations aren’t strong in this view.
Is Total Employment useful for forecasting NICS checks in Oregon?
Not in this specific snapshot. Employment has near-zero r values and high p-values across all four NICS measures shown.
What’s a good next chart to look at?
A time-series trend line for Oregon showing TotalChecks and AdjustedChecks alongside Personal Income and Hunting/Trapping over the same 5-year period would make the “moves together” story easier to see.
Conclusion
This Oregon NICS checks snapshot (5-year view) highlights two practical signals—Personal Income and Hunting and Trapping—that line up most clearly with overall check activity in the dashboard’s correlation grid. Meanwhile, jobs, consumer spending, and the category-specific check measures don’t show a strong, reliable pattern in this visualization. Check out our interactive NICs Checks Dashboard page for more insights.