North Carolina NICS Checks vs. Income, Employment, and Outdoor Participation (5-Year Correlation Snapshot)
If you’ve ever wondered what really moves North Carolina NICS checks—paychecks, jobs, or outdoor participation—this chart gives a clean, data-first clue. It compares North Carolina background-check activity against several economic and recreational indicators over a 5-year window, showing which relationships look meaningful and which ones don’t rise above noise.
Snippet-ready definition: A “correlation” is a simple way to describe whether two things tend to move together over time (and how strongly). It does not prove one caused the other.
Quick Take
- HandgunChecks show the clearest “moves together” pattern with income, consumer spending, and employment (all positive and statistically significant in the image).
- AdjustedChecks also track positively with the same economic indicators, though slightly less than handgun checks in most rows.
- Recreation signals matter: “Hunting and Trapping” and “Shooting Including Archery” both line up positively with TotalChecks, AdjustedChecks, and HandgunChecks.
- LongGunChecks are the outlier: in this view, long gun checks are not statistically significant versus any listed factor (all shown as “Not Significant”).
- Best use: treat this as a planning compass (staffing, inventory mix, training calendars), not a cause-and-effect verdict.
What the image shows
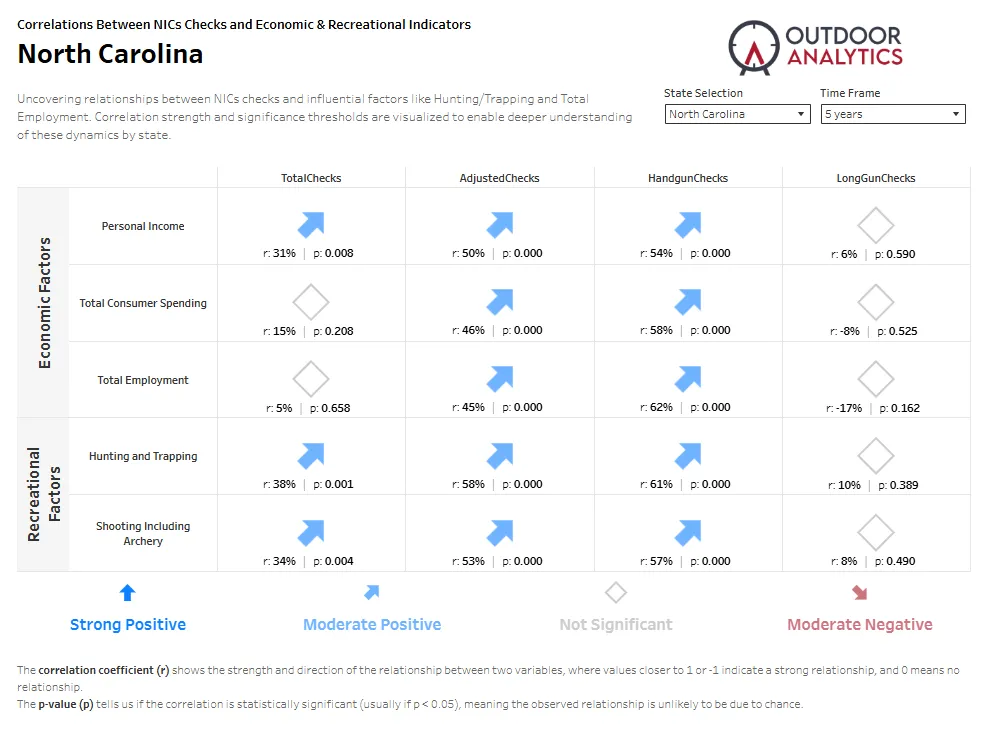
The visual is a correlation matrix titled “Correlations Between NICS Checks and Economic & Recreational Indicators” for North Carolina with a Time Frame: 5 years. Across the top are four NICS-related series: TotalChecks, AdjustedChecks, HandgunChecks, and LongGunChecks.
Down the left side are two groups of factors:
- Economic Factors: Personal Income, Total Consumer Spending, Total Employment
- Recreational Factors: Hunting and Trapping, Shooting Including Archery
Each cell shows two numbers: r (the strength and direction of how closely the two series move together) and p (whether the relationship is considered statistically significant in the chart’s rules, typically when p < 0.05). Upward blue arrows indicate a positive relationship that clears the significance threshold. Gray diamonds indicate Not Significant. A small red/down marker would indicate a negative significant relationship (not shown as significant anywhere in this North Carolina view).
Snippet-ready summary: In this 5-year North Carolina snapshot, handgun and adjusted checks tend to rise and fall with broad economic measures and with hunting/shooting participation, while long gun checks do not show a statistically reliable link to the factors listed.
The biggest takeaways
- HandgunChecks lead the economic ties. Personal income (r=54%, p=0.000), consumer spending (r=58%, p=0.000), and employment (r=62%, p=0.000) are all strong, positive, and significant in the image.
- AdjustedChecks mirror the pattern. Income (r=50%, p=0.000), spending (r=46%, p=0.000), and employment (r=45%, p=0.000) are all positive and significant.
- TotalChecks are positive, but more modest. Income (r=31%, p=0.008) and recreational measures (r=38%, p=0.001; r=34%, p=0.004) show meaningful positive links, while spending and employment are not significant for TotalChecks in this view.
- Recreation indicators align with handgun and adjusted checks. Hunting and Trapping (HandgunChecks r=61%, p=0.000; AdjustedChecks r=58%, p=0.000) and Shooting Including Archery (HandgunChecks r=57%, p=0.000; AdjustedChecks r=53%, p=0.000) are consistently positive and significant.
- LongGunChecks don’t clear “significant” anywhere on this chart. Even when r is slightly positive or negative (e.g., -17% with employment), every p-value shown is above 0.05.
- Practical interpretation: if you’re forecasting demand or participation, handgun and adjusted checks may be more responsive to broad “life is busy and money is moving” cycles, while long-gun checks may be driven by different variables not included here (seasonality, product cycles, local preferences, or other factors not shown).
- Use-case tip: If your planning decisions hinge on long guns, don’t assume “jobs up = long gun checks up” from this visual—this specific relationship isn’t supported as significant here.
Data table from the image
Below is the data transcribed directly from the image. Values are shown as r (relationship strength/direction) and p (significance indicator used by the visualization). Where the chart marks a cell as not significant, it’s still listed here with its r and p exactly as shown.
| Factor group | Factor | TotalChecks (r, p) | AdjustedChecks (r, p) | HandgunChecks (r, p) | LongGunChecks (r, p) |
|---|---|---|---|---|---|
| Economic | Personal Income | r: 31% | p: 0.008 | r: 50% | p: 0.000 | r: 54% | p: 0.000 | r: 6% | p: 0.590 |
| Economic | Total Consumer Spending | r: 15% | p: 0.208 | r: 46% | p: 0.000 | r: 58% | p: 0.000 | r: -8% | p: 0.525 |
| Economic | Total Employment | r: 5% | p: 0.658 | r: 45% | p: 0.000 | r: 62% | p: 0.000 | r: -17% | p: 0.162 |
| Recreational | Hunting and Trapping | r: 38% | p: 0.001 | r: 58% | p: 0.000 | r: 61% | p: 0.000 | r: 10% | p: 0.389 |
| Recreational | Shooting Including Archery | r: 34% | p: 0.004 | r: 53% | p: 0.000 | r: 57% | p: 0.000 | r: 8% | p: 0.490 |
How to read this table: The r value tells you whether the two lines tend to move together (positive) or in opposite directions (negative), and how tightly they track (closer to 0 means weak; farther from 0 means stronger). The p value is the chart’s “confidence check” for whether the relationship is likely real in this dataset; in the visual’s rules, values under about 0.05 are treated as statistically significant.
What this means for you
Beginners and new gun owners
If you’re new, the most useful takeaway is that handgun background-check activity in North Carolina tends to move with broad economic momentum (income, employment, spending) and also with participation-style signals (hunting/trapping and shooting/archery). The chart suggests that when life is economically “busy,” more people may be buying, transferring, or otherwise triggering checks for handguns.
Practical use: if you’re planning your first purchase, training, or range time, you may see busier shops and ranges when economic indicators are strong. Build in extra time for appointments, classes, and selection.
Competitors and recreational shooters
The recreation rows are the loudest signal for planning: both Hunting and Trapping and Shooting Including Archery align positively with TotalChecks, AdjustedChecks, and HandgunChecks. The chart suggests participation and purchasing/transfer activity often rise together over this 5-year window.
- If you run matches, leagues, or training, consider that participation upticks may come alongside increased handgun-check activity (potentially more new shooters entering the pipeline).
- If you’re gearing up, schedule instruction and maintenance early—busy seasons can compress class availability.
Hunters
The “Hunting and Trapping” relationship is positive and significant for TotalChecks (r=38%, p=0.001), AdjustedChecks (r=58%, p=0.000), and HandgunChecks (r=61%, p=0.000). What it doesn’t show is just as important: LongGunChecks are not significant versus hunting and trapping here (r=10%, p=0.389).
Interpretation (not proof): in this dataset, hunting participation may track more with overall check volume and handgun-related checks than with long gun checks specifically. If your planning is long-gun-heavy, you may need other signals (season timing, local preferences, retailer mix) that aren’t included in this chart.
Retailers, ranges, and brands
If you’re forecasting staffing, inventory, or marketing, this matrix suggests a split:
- Handguns (and adjusted totals) appear tightly connected to broad economic strength and to participation-style indicators in North Carolina (in this 5-year view).
- Long guns do not show a statistically reliable relationship with these specific factors, so treating income/employment as a “long gun demand dial” could mislead.
Operationally, that can inform how you allocate shelf space, training calendars, and customer education. For example, if your handgun category is your primary driver, monitoring employment and personal income trends may be more useful than it is for long-gun-only planning (based on this chart alone).
Safety reminder: Whatever your goals—hunting, sport, or personal protection—follow local laws, manufacturer guidance, and range rules, and prioritize safe storage and handling practices.
Smart next steps
- Separate “handgun + adjusted” planning from “long gun” planning. This chart supports the former more clearly than the latter in North Carolina.
- Watch the strongest pairings first: HandgunChecks vs. Total Employment (r=62%), Hunting and Trapping (r=61%), and Total Consumer Spending (r=58%).
- Use recreation signals for scheduling. If you manage classes, leagues, or events, plan for higher demand when participation indicators rise.
- Don’t overread weak/non-significant cells. For example, TotalChecks vs. Total Employment is r=5% with p=0.658—this view doesn’t support a meaningful relationship.
- Add one more dashboard layer (if available): break out by season or month to see whether long gun checks have a seasonal pattern that’s being washed out in this broad correlation view (seasonality is not shown in the image).
Common questions
Do these correlations prove that income or employment causes more NICS checks?
No. The chart shows that the lines tend to move together (or not) over time. It doesn’t prove cause-and-effect, and it doesn’t rule out other drivers that aren’t included.
Why do HandgunChecks look more connected than LongGunChecks here?
In this North Carolina 5-year snapshot, the handgun relationships with income, spending, employment, and recreation factors all clear the chart’s significance threshold (p shown as 0.000). Long gun checks do not, which suggests long gun activity may be influenced by different variables or timing patterns not captured by these factors (not shown).
What’s the difference between TotalChecks and AdjustedChecks?
The image labels both series but does not define how “AdjustedChecks” are calculated. If your decisions depend on that difference, use the definition from the dashboard’s methodology (not shown in the image).
What does a p-value of 0.000 mean on this chart?
It indicates the value is extremely small and treated as statistically significant by the visualization (often meaning p is below the displayed rounding threshold). The exact underlying value isn’t shown—only “0.000.”
How can I use this if I’m running a range or retail store?
Use the strongest, significant pairings as early signals for busy periods—especially the handgun and adjusted totals. For long guns, rely on additional indicators (seasonality, product cycles, local hunting calendar, promotions) because the economic/recreation factors shown here don’t appear statistically reliable for LongGunChecks.
Conclusion
This chart suggests that North Carolina NICS checks—especially HandgunChecks and AdjustedChecks—tend to move with broad economic strength and with hunting/shooting participation indicators over the last 5 years shown. Meanwhile, LongGunChecks don’t show a statistically significant relationship with the factors listed, which is a useful caution for anyone planning long-gun inventory, programming, or marketing based on macro signals alone. Check out our interactive NICs Checks Dashboard page for more insights.