Wisconsin NICS Checks vs Economy & Hunting (5-Year)
If you’ve ever wondered why firearm background-check activity feels like it surges at certain times (and falls flat at others), you’re not imagining it. This Outdoor Analytics snapshot looks at Wisconsin NICS checks over the last five years and compares them to a few real-world drivers: income, spending, employment, and outdoor participation.
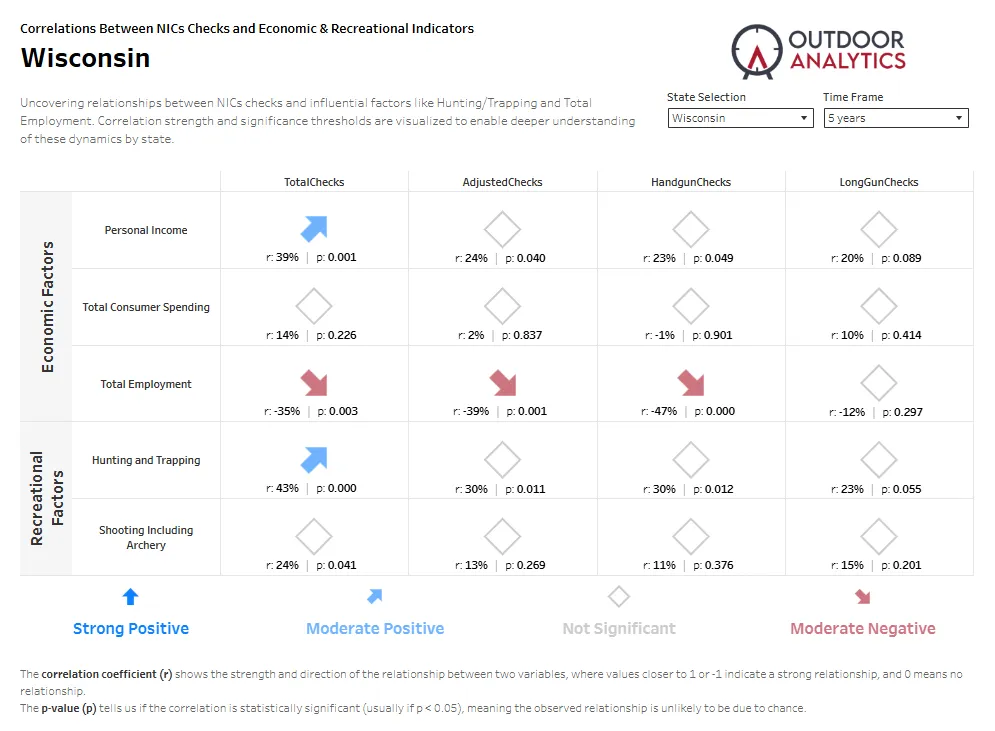
Quick note on what you’re seeing: each cell shows how closely two things “move together.” The little confidence note (the “p” value in the chart) is basically a reality check that helps filter out patterns that might just be noise. So, we’ll focus most on the relationships that look both meaningful and reliable.
What the dashboard says about Wisconsin NICS checks
In Wisconsin, two themes jump off the page:
- Hunting and trapping activity lines up with more total checks. When hunting/trapping indicators rise, total background checks tend to rise too.
- Employment moves the other direction—especially for handguns. When employment trends are stronger, the handgun-check side of the chart tends to be lower (and vice versa).
Meanwhile, general consumer spending is basically a shrug emoji here—there’s not much consistent connection in this view.
Income, employment, and why “handgun checks” look different
The chart suggests personal income in Wisconsin has a noticeable “moves together” relationship with total checks. But when you split things into handgun vs long gun checks, the story gets more nuanced:
- Handgun checks show the clearest negative tie to employment. That doesn’t mean “jobs cause fewer checks.” It’s simply a pattern in the data: these lines often move opposite each other over this time window.
- Long gun checks look weaker and less consistent. That’s a good reminder that long-gun demand can be more seasonal (think hunting) and can also be influenced by how checks are processed and categorized.
If you’re a dealer, range, or brand trying to forecast demand, the practical takeaway is this: segmenting by check type matters. “Total” can hide what’s really happening inside handguns vs long guns.
The data table from the Wisconsin (5-year) view
Below is the exact data shown in the dashboard image, captured as a text table for easy reference.
| Factor | Total Checks (r / p) | Adjusted Checks (r / p) | Handgun Checks (r / p) | Long Gun Checks (r / p) |
|---|---|---|---|---|
| Personal Income | 39% / 0.001 | 24% / 0.040 | 23% / 0.049 | 20% / 0.089 |
| Total Consumer Spending | 14% / 0.226 | 2% / 0.837 | -1% / 0.901 | 10% / 0.414 |
| Total Employment | -35% / 0.003 | -39% / 0.001 | -47% / 0.000 | -12% / 0.297 |
| Hunting and Trapping | 43% / 0.000 | 30% / 0.011 | 30% / 0.012 | 23% / 0.055 |
| Shooting Including Archery | 24% / 0.041 | 13% / 0.269 | 11% / 0.376 | 15% / 0.201 |
What to do with this insight
Here are a few “boots-on-the-ground” ways to use this:
- Retail planning: If your Wisconsin business leans handgun-heavy, watch broader workforce signals and local events—not just hunting season hype.
- Marketing timing: For long guns, align campaigns with outdoors participation and seasonal shopping rhythms.
- Inventory mix: Don’t rely on a single “total checks” trendline. Break it out by handgun vs long gun to avoid overbuying the wrong category.
- Content strategy: Wisconsin audiences respond to practical, season-ready messaging: range time, sight-in, safe storage, and “gear check” reminders.
Wrap-up: Wisconsin NICS checks tell a seasonal, segmented story
The big picture is pretty clear: Wisconsin NICS checks track most cleanly with outdoors participation (especially hunting and trapping) and show a notable “opposite direction” pattern against employment in the handgun slice. Consumer spending, in this view, doesn’t add much signal. Check out our interactive NICs Checks Dashboard page for more insights.