NICS Checks vs. New Jersey’s Economy: What 5 Years of Data Says
If you’ve ever wondered how background checks for gun purchases move with the Garden State’s economy, this quick read is for you. We pulled insights from a five-year Outdoor Analytics correlation dashboard for New Jersey to see how things like personal income, consumer spending, and outdoor participation line up with NICS checks—especially handguns and long guns. The short version: money matters more than weekend hobbies in this dataset.
Key Takeaway: Stronger Wallets, More Checks
The strongest relationships in New Jersey show up between NICS checks and broad economic health—particularly personal income and total consumer spending. When New Jersey households bring in more income and spend more, background checks—especially for handguns—tend to rise.
- Personal Income: Moderate-to-strong positive relationship with TotalChecks and HandgunChecks (about the low-50% range for correlation). This pattern is also statistically reliable, meaning it’s unlikely to be a fluke.
- Total Consumer Spending: Moderate positive relationship with TotalChecks and HandgunChecks (mid-30% to high-30%). Also statistically reliable in the five-year view.
- LongGunChecks: Weaker ties to the economy overall. Personal income shows a smaller positive link, while most other factors aren’t significant.
Participation Factors: Not a Big Driver Here
We looked at two recreational indicators—Hunting & Trapping and Shooting Including Archery. Across five years, those activities don’t show a strong or reliable pattern with checks in New Jersey. In plain English, fluctuations in participation don’t consistently move background checks up or down in this state-level view.
- Hunting & Trapping: Weak and not statistically meaningful with either handguns or long guns.
- Shooting Including Archery: Also weak; small positives for handguns and small negatives for long guns, none statistically reliable.
Employment: Lots of Noise, Little Signal
Total Employment looks noisy in this slice—small correlations across the board and not statistically meaningful. In other words, jobs alone aren’t explaining much of New Jersey’s check activity over this window.
Data Table (New Jersey • 5-Year Correlations)
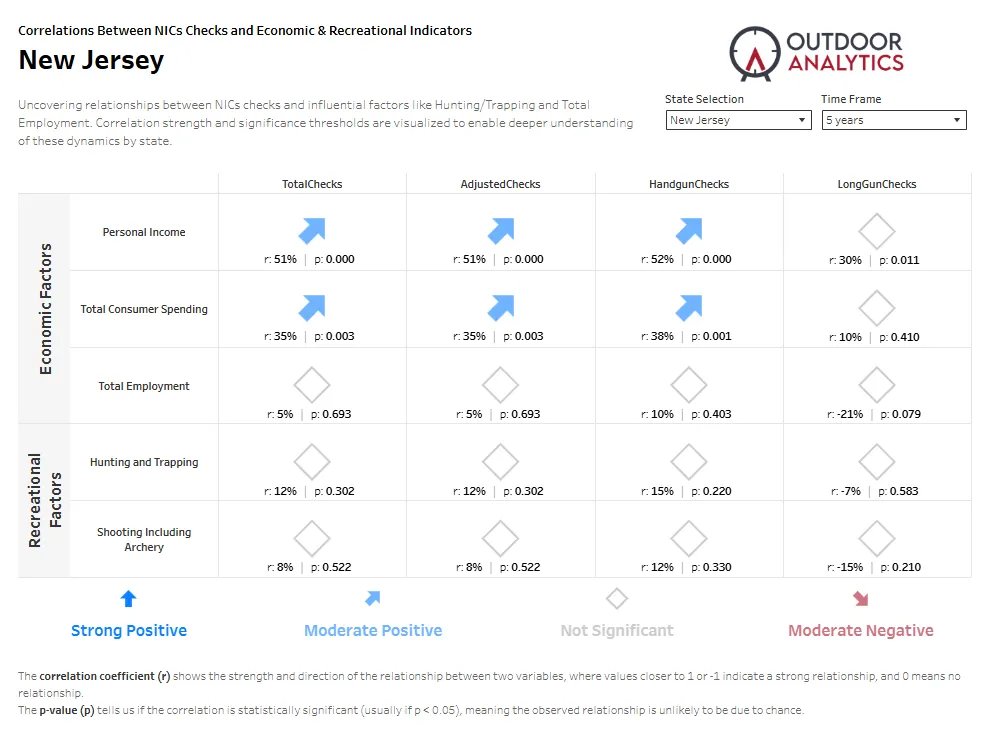
The table below captures what’s shown on the dashboard. “r” indicates the direction and strength of the relationship (closer to 1 or −1 means stronger), and “p” tells us if that pattern is statistically reliable (p < 0.05 is usually considered significant).
| Indicator | TotalChecks (r, p) | AdjustedChecks (r, p) | HandgunChecks (r, p) | LongGunChecks (r, p) |
|---|---|---|---|---|
| Personal Income | 0.51, 0.000 | 0.51, 0.000 | 0.52, 0.000 | 0.30, 0.011 |
| Total Consumer Spending | 0.35, 0.003 | 0.35, 0.003 | 0.38, 0.001 | 0.10, 0.410 |
| Total Employment | 0.05, 0.693 | 0.05, 0.693 | 0.10, 0.403 | -0.21, 0.079 |
| Hunting & Trapping | 0.12, 0.302 | 0.12, 0.302 | 0.15, 0.220 | -0.07, 0.583 |
| Shooting Including Archery | 0.08, 0.522 | 0.08, 0.522 | 0.12, 0.330 | -0.15, 0.210 |
What This Means for New Jersey Dealers & Ranges
- Watch the wallet indicators. When income and spending rise, expect more interest—especially in handguns. Plan inventory, staffing, and training calendars accordingly.
- Long gun demand is less tied to the economy. Promotions and seasonal campaigns may matter more than macro trends for rifles and shotguns.
- Participation isn’t the lever (in this dataset). Don’t rely on hunting or archery club activity alone to forecast sales. Pair those signals with economic indicators for better planning.
How to Read “r” and “p” Without the Jargon
“r” is a score that tells us whether two things tend to move together. Positive means they rise together; negative means they move in opposite directions. Bigger absolute values mean a stronger link. “p” is a reality check: small values (below 0.05) mean the pattern is probably real, not random wiggles.
Bottom Line
For New Jersey, the clearest story is simple: when households are doing better financially, handgun background checks climb. Long guns tell a softer story. If you’re planning inventory, classes, or marketing in the Garden State, keep an eye on income and spending—they’re the compass that points toward demand. Check out our interactive NICs Checks Dashboard page for more insights.